رشد روزانه دلار بازار آزاد (USD/IRR) در ادااردیبهشت روند صعودی
دلار آمریکا در بازار آزاد (USD/IRR) در ۵ مرداد ۱۴۰۵ با 15,000 ریال افزایش، در 1,880,000 ریال بسته شد.
خلاصه بازار
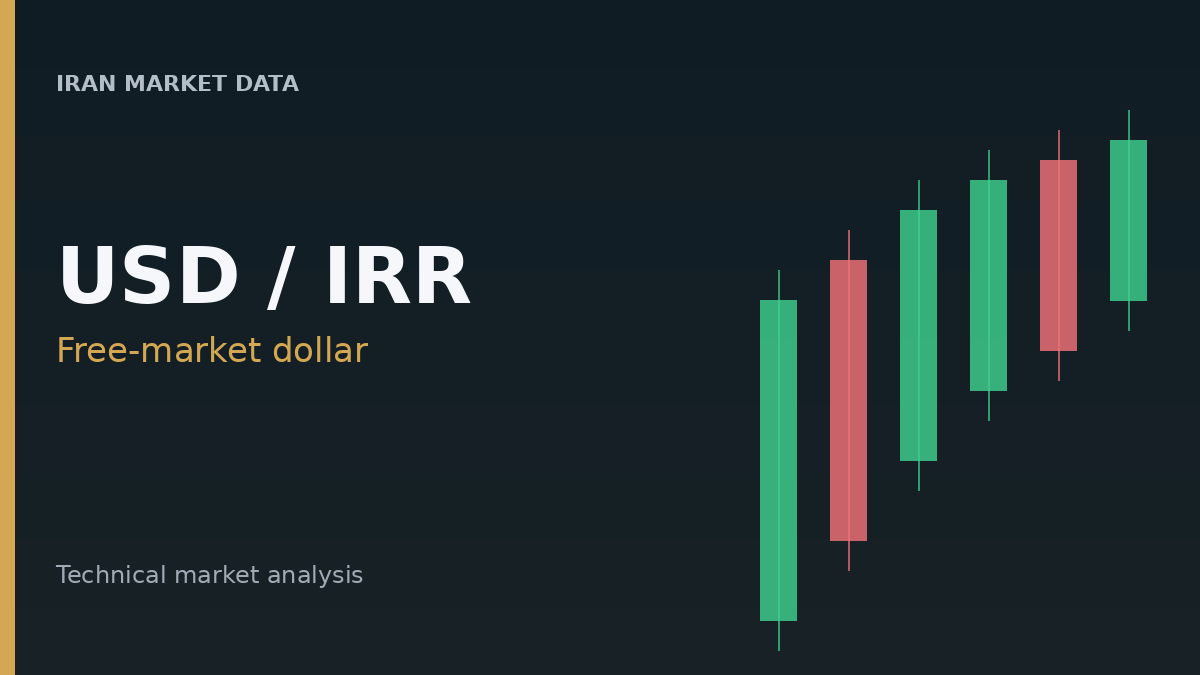
دلار آمریکا در بازار آزاد (USD/IRR) در ۵ مرداد ۱۴۰۵ با 15,000 ریال افزایش، در 1,880,000 ریال بسته شد. دامنه معاملات روز 38,400 ریال بود؛ قیمت از 1,863,900 ریال آغاز شد، تا سقف 1,902,200 ریال پیش رفت و کف 1,863,800 ریال را لمس کرد.
تحلیل بازار
دلار بازار آزاد در روز معاملاتی اخیر حرکت صعودی ثبت کرد. ساختار کلی بازار صعودی ارزیابی میشود، زیرا قیمت فعلی بالاتر از میانگینهای متحرک ساده 20، 50 و 200روزه در سطوح 1,852,357، 1,760,847 و 1,587,173 ریال معامله میشود.
قیمت حدود 3.6% پایینتر از سقف 52هفتهای 1,950,200 ریال و حدود 83.4% بالاتر از کف 52هفتهای قرار دارد. نوسانپذیری 30 روز گذشته حدود 1.57% است. حمایت فوری در 1,745,800 ریال و مقاومت در 1,950,200 ریال شناسایی میشود.
نکات تکنیکال
شاخصهای مومنتوم تصویری ترکیبی ارائه میکنند. RSI در 57.28 و بالاتر از آستانه خنثی، مومنتومی نسبتاً مثبت را نشان میدهد. با این حال، هیستوگرام MACD در -2,908 منفی است و خط MACD پایینتر از خط سیگنال قرار دارد؛ وضعیتی که تضعیف اخیر مومنتوم صعودی کوتاهمدت را نشان میدهد.
ADX در 27.71 از قدرت متوسط روند حکایت دارد. +DI در 35.29 بالاتر از -DI در 26.91 است و غلبه نیروی خرید را نشان میدهد.
Supertrend با معامله قیمت بالاتر از سطح 1,833,308 ریال، سیگنال صعودی میدهد. در مقابل، PSAR به دلیل قرار گرفتن قیمت پایینتر از مقدار 1,948,272 ریال، سیگنالی نزولی ارائه میکند.
Aroon Oscillator در -70.83، همراه با Aroon Down در 100.0 و Aroon Up در 29.17، روند نزولی قدرتمندی را در دوره بررسی نشان میدهد که با روند صعودی گستردهترِ نمایان در میانگینهای متحرک در تضاد است.
جمعبندی
دلار آمریکا در بازار آزاد (USD/IRR) روز معاملاتی اخیر را با رشد به پایان رساند و با توجه به موقعیت خود نسبت به میانگینهای متحرک مهم، روند صعودی کلی را حفظ کرد. برخی شاخصهای مومنتوم از فضای مثبت متوسط و غلبه خریداران حکایت دارند، اما MACD و Aroon Oscillator تضعیف اخیر یا سیگنالهای کوتاهمدت متضاد را نشان میدهند. دادههای موجود بازار بهتنهایی علت بنیادی این حرکت قیمت را مشخص نمیکنند.
نرخهای زنده
آخرین وضعیت معاملات دلار آمریکا در بازار آزاد (USD/IRR) را در پرایس۳۶۰ دنبال کنید.