یورو (EUR/IRR) با حفظ روند صعودی، افت روزانه ثبت کرد
یورو (EUR/IRR) در ۱۱ مرداد ۱۴۰۵ کاهش یافت و پایینتر از قیمت بازگشایی بسته شد. با وجود این عقبنشینی، ساختار کلی بازار همچنان صعودی است.
خلاصه بازار
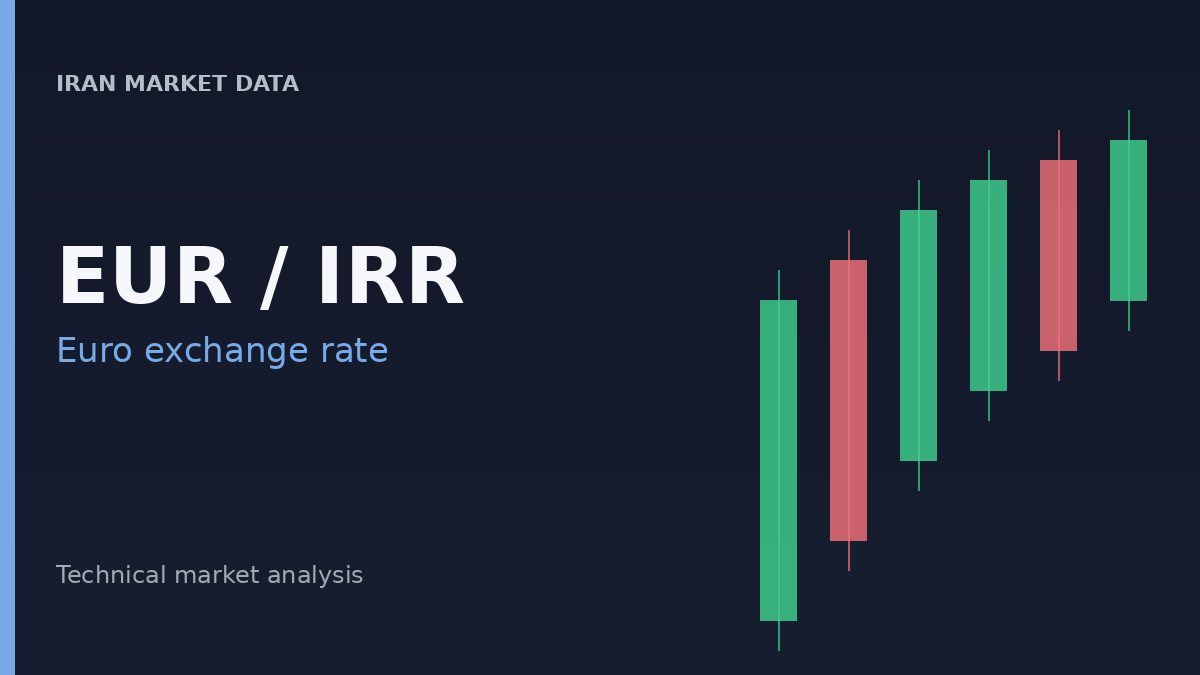
یورو (EUR/IRR) در ۱۱ مرداد ۱۴۰۵ کاهش یافت و پایینتر از قیمت بازگشایی بسته شد. این نخستین روز از افت متوالی این جفتارز بود. با وجود عقبنشینی روزانه، ساختار کلی بازار یورو در برابر ریال همچنان صعودی است و قیمت بالاتر از میانگینهای متحرک کلیدی معامله میشود.
تحلیل بازار
در ۱۱ مرداد ۱۴۰۵، یورو در 2,242,400 ریال باز شد که سقف روز نیز بود و فشار نزولی فوری از آغاز معاملات را نشان داد. سپس قیمت تا کف 2,205,100 ریال کاهش یافت و در 2,207,400 ریال بسته شد. این حرکت معادل افت روزانه 35,000 ریال نسبت به قیمت بازگشایی است.
رفتار اخیر قیمت نشان میدهد یورو در مسیری صعودی بوده و قیمت فعلی بالاتر از میانگینهای متحرک ساده 20، 50 و 200 روزه معامله میشود. سقف 2,242,400 ریال در آخرین روز معاملاتی به مقاومت شناساییشده 2,249,500 ریال نزدیک شد. یورو اکنون حدود 1.87% پایینتر از اوج 52 هفتهای و همچنان بهطور محسوسی بالاتر از کف 52 هفتهای قرار دارد.
نکات تکنیکال
پس از افت اخیر، شاخصهای مومنتوم تصویری متفمرداد ارائه میکنند. RSI دوره 14 در 60.13 قرار دارد و بدون ورود به محدوده اشباع خرید، مومنتوم نسبتاً مثبت را نشان میدهد. هیستوگرام MACD در محدوده منفی و برابر با -374.42 است و خط MACD پایینتر از خط سیگنال قرار دارد؛ وضعیتی که از تضعیف اخیر مومنتوم صعودی حکایت دارد.
ADX در 24.22 از وجود روند در بازار حکایت دارد و +DI در 36.60 بالاتر از -DI در 23.87 باقی مانده است؛ بنابراین روند صعودی زیربنایی همچنان غالب است. Supertrend و PSAR نیز با قرار گرفتن قیمت بالاتر از سطوح 2,115,932 و 2,115,240 ریال، جهت صعودی را نشان میدهند. با این حال، Aroon Down در 100 و Aroon Up در 4.16 قرار دارند و Aroon Oscillator برابر با -95.83 است که به مومنتوم نزولی قدرتمند اخیر اشاره دارد.
جمعبندی
یورو (EUR/IRR) در ۱۱ مرداد ۱۴۰۵ افت روزانه ثبت کرد و نخستین روز از کاهش متوالی خود را پشت سر گذاشت. با وجود این عقبنشینی و نشانههای تضعیف مومنتوم در MACD و Aroon، ساختار کلی بازار همچنان صعودی است؛ قیمت بالاتر از میانگینهای متحرک کلیدی مانده و ADX برتری روند صعودی را نشان میدهد. دادههای موجود بازار بهتنهایی علت بنیادی این حرکت قیمت را مشخص نمیکنند.
نرخهای زنده
آخرین معاملات یورو (EUR/IRR) را در پرایس۳۶۰ دنبال کنید.